Wednesday, April 10, 2013

Lab 7: Op amps 1


Intro:
The purpose of this lab is to use an operational amplifier to produce an output of 0 to 10 volts, draw no more than 1mA, and supply no more than 30mW of power.

Experiment:


Component      Nominal Value            Measured Value
Rf                     2KΩ                             2.14kΩ
Rf                     2.2KΩ                          2.15KΩΩ
RX                     12KΩ                           11.16KΩ
RY                     100Ω                           98Ω
V1                    12V                              12.28V
V2                    12V                              12.09V

Data:

            VIN        VOUT     GAIN    V­­Ri        IRi                     VRf
            0.0V     0            0          0          0                      0
            0.25V   2.48V   10        .249V   .115mA            .248V
            0.50V   4.97V   10        .500V   .231mA            .500V
            0.75V   7.48V   10        .751V   .348mA            .750V
            1.00V   10.03V 10        1.007V .466mA            1.006V
At VIN = 1.00V 
IV1 = 1.731 mA             IV2 = 1.276 mA

Analysis:
PV1 = V*I=12.2(.001727)= 21.21mW
PV2 = V*I=12.09(.00126)= 15.43mW
The circuit satisfies the power constraint of 30mW. The circuit  can out put 10V with about 1mA of current.

Lab 6: Maximum Power Transfer


Intro:
The purpose of this lab is to experimentally verify the Maxumum Power Transfer Theorem.
P=(Vth /(Rth + RL)2 *RL
Power maximum when Rth = RL
Experiment and Data:
Part A


Data part A


Vo(volts)
Rx(ohms)
Power(mW)
0.015
120
0.001875
0.037
712
0.00192275
0.045
1220
0.00165984
0.069
1890
0.00251905
0.076
2160
0.00267407
0.09
2590
0.00312741
0.117
3590
0.00381309
0.132
4310
0.00404269
0.166
5150
0.00535068
0.165
5730
0.00475131
0.176
6370
0.00486279
0.19
7150
0.00504895
0.219
8940
0.00536477
0.243
10770
0.00548273
0.251
11360
0.00554586

Analysis


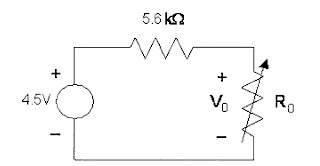
Max power was at around 5.15k ohms.  The theoretical resistance of max power is when the load resistance equals the thevenin resistance.  Since the thevenin resistance is 5.6k ohms the, the load resistance of max power is 5.6k ohms.  The percent error is 8.04%


Part B

We tried to use LoggerPro to find the thevenin resistance, but the program did not work. There was too much noise in the measuring devices.


Lab 5: Thevenin Equivalence


Intro:
The purpose of this lab is to show that a circuit and the thevenin equivalence of the circuit are the same.

Experiment and Data:

Vth=8.6433


Rth=65.95

RL2,min=824.74

Thevenin Equivalent

Config              Theoretical value        Measured value          percent error
RL2=RL2,min         Vload2=8                        7.82                             2.25
RL2=Infinite      Vload2=8.64                   8.87                             2.66

Original Circuit

 
 Config             Theoretical value        Measured value          percent error circuit
RL2=RL2,min         Vload2=8                        8.02                             0.25
RL2=Infinite      Vload2=8.64                   8.77                             1.50

Both the original circuit and the thevenin equivalent have the same voltage within the margin of error.

Lab 3: Voltage Dividers


Intro:
The purpose of this lab is to specify the characteristics of an unregulated power supply with three loads.

Experiment:


Data:
If R1= R2 = R3= 1K ohms
REQ max = 1000 ohms
REQ min = 333.3 ohms

VBUS
VBUS,max =  6.25V
VBUS, min = 7.25V

Using VBUS = Vs*REQ/(RS+REQ)
            Vs= 6.53          Rs= 45.45

Using ohms law
 IBUS= VBUS/(RS+REQ)
            IBUS,max=5.98 mA
            IBUS, min= 15.18mA

Analysis:
Percent voltage variation
            5.81-5/5=16.2%                       5±16.2%
If added a fourth 1K resistor
            Resistance = 1000/4 = 250 ohms
            VBus = Vs*R/(R+RL) = 6.53*250/(45.45+250)= 5.52V
If we wanted to reduce the load voltage variation to 1% we want VBus= 5.001.

Lab 2: Introduction to Biasing


Intro:
The purpose of this lab is to use biasing to establish the correct voltage and current across two LEDs connected in parallel to a battery.

Experiment:


Data:
IR1= 22.75mA   IR2 = 20Ma
VR1= 4V            VR2 = 7V

Using R=V/I
R1=175.82       R2 = 350

The closest Resistances we will use are 220 ohms and 470 ohms.
            ILED1      VLED1     ILED2      VLED2     ISupply
1          .47mA  6.28V   .54mA  2.236V X
2          .40mA  6.22V   x          x          .40mA
3          x          x          2mA     2.14V   2mA

 Analysis:
The life for an LED attached 9 volt batter at 0.2 A-hr
            LED = .2/.00047 = 425.5 hours
The error
LED1 = (.47-40)/.40 = 17.5%
LED2 = (.54-2)/2 = 73%

Efficiency = Pout/(Pout + Plost)
Pout = i*V= .006768
Plost = i*V= .0041
Efficiency = 71.76%

Lab 1: Introduction to DC Circuits


Intro:
The purpose of this lab is to find the resistance of cables attached from a battery to a load. In the following figure. 


The cables are represented by a resistors, which we will call RCable tot.


Experiment:


To find the load resistance of a load supplied with 12V and consumes .044W we get
            RLoad=V^2/P=12^2/.144=1000 ohms

Data
RLoad = 998 ohms
Vload=11.00V
IBatt = 11.45mA
RCable tot = 98 ohms

Analysis;
For a .8 Ahr the device will last
.8Ahr*.01145A=70.0 hours

The efficiency can be calculated by Pout/(Pout + PLost)
Pout = V^2/R=11^2/998
PLost = I^2V = (.01145)*98=.01284
Pout/(Pout + PLost)*100=90.41%

Given a resistance of AWG #30 of .345ohms/m the maximum distance is
            98ohms/(.345omhs/m)=284.0 m

An AWG# 28 that can keep a 20mA 5V signal is 1576ft long.

Sending a 48 volt signal at 10 amps that will deliver 36 volts to a sub 60ft  below needs a resistance of .02 ohms per feet. ohms.  AWG#22 is .0190 ohms per feet.
 

Lab 4: Transistors


Intro:
The purpose of this lab is to get acquainted with transistors by finding gain and saturation point.

Experiment:

Finger switch


Data:
Milliamps through A1 Milliamps through A2
0                                  0
.28                               53.3
.3                                 53.9
.45                               61.1
.6                                 65.8
.75                               69.0

Analysis:

Graph

The gain of the transistor is the slope in the beginning which has a slope of 190.  The saturation is the flat line about 70 milliamps.